
The Dire Water Crisis in the Colorado River Basin: Lake Powell and Lake Mead on the Brink
- Rex Ballard

- Feb 15
- 4 min read
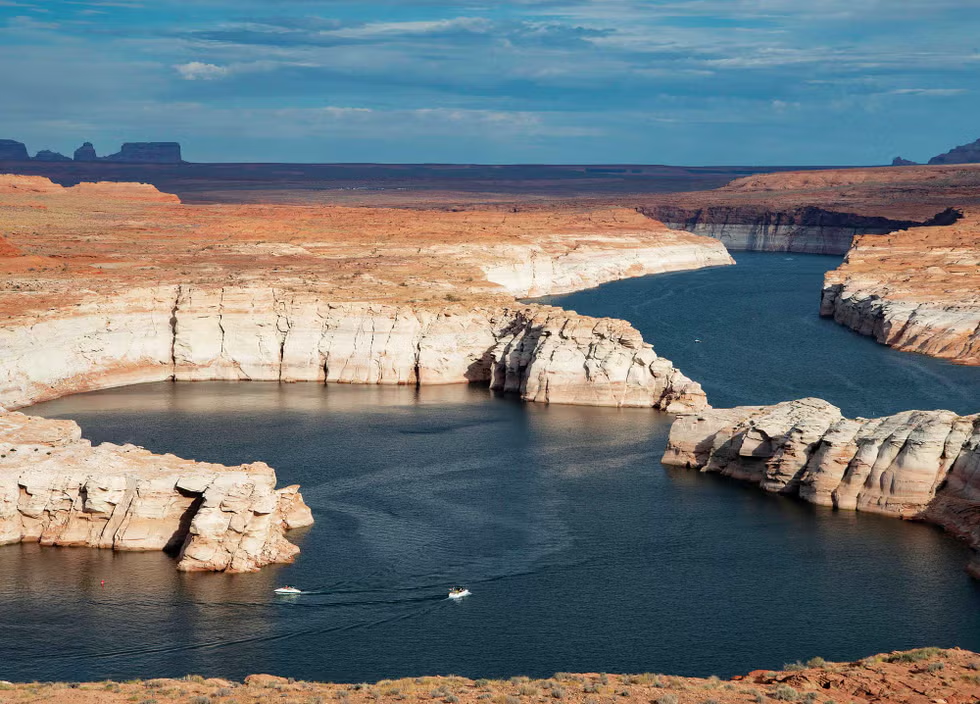
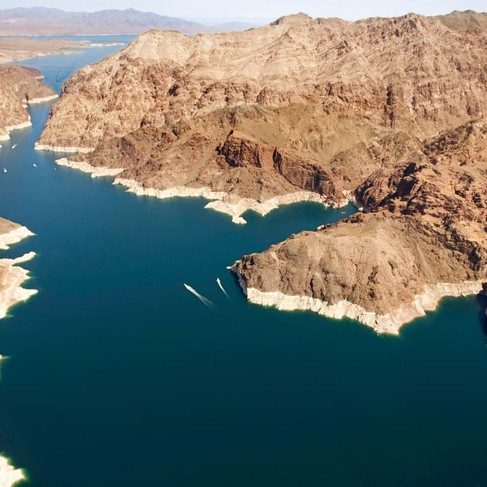
The Colorado River, a lifeline for over 40 million people across the American Southwest, is facing an unprecedented crisis. At the center of this crisis are Lake Powell and Lake Mead, the two largest reservoirs in the United States, both hovering at critically low levels as of mid-February 2026. Lake Powell, created by Glen Canyon Dam, is currently at approximately 3,533 feet above sea level—about 167 feet below full pool—and holds only about 24% of its total capacity. Downstream, Lake Mead, behind Hoover Dam, is at around 1,065.91 feet, or 34% full. These reservoirs, integral to water supply, hydropower, and recreation, are emblematic of a system strained by decades of overuse. The dramatic "bathtub rings"—white mineral deposits marking former high-water marks—visibly illustrate the recession, exposing vast expanses of canyon walls.
The overall Colorado River system is at 36-37% capacity, down from 42% the previous year, with inflows to Lake Powell at only 48-52% of average in recent water years. This has ripple effects upstream and downstream, threatening communities, agriculture, tourism, and infrastructure. While warmer weather patterns contribute by increasing evaporation and shifting runoff timing, the primary culprits are explosive population growth in basin states and longstanding poor water management practices by state and federal agencies.


Current Status of Lake Powell and Lake Mead
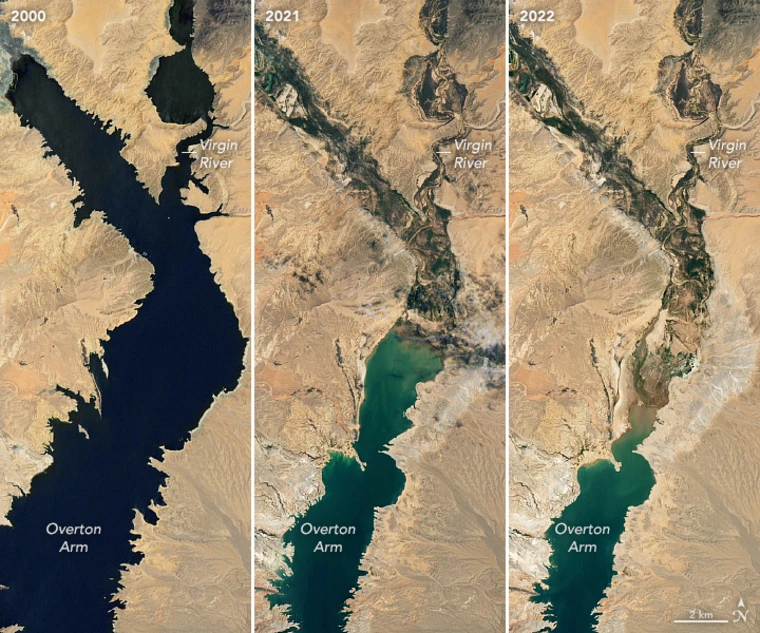
Lake Powell's rapid decline is marked by daily drops of 0.1-0.2 feet due to releases from Glen Canyon Dam and minimal inflows. Federal projections indicate further declines in 2026, potentially affecting hydropower generation if levels approach the critical 3,490-foot threshold. Lake Mead, meanwhile, is operating under Tier 1 shortage conditions in 2026, with the risk of deeper Tier 3 cuts if it falls below 1,050 feet. Satellite imagery highlights the stark changes over the decades, showing shrunken shorelines and exposed land.

Situation Upstream from Lake Powell
Upstream reservoirs in the Upper Colorado River Basin, fed by Rocky Mountain snowmelt, are showing mixed but generally strained conditions. The basin's snowpack is at 58% of normal, leading to below-average spring runoff forecasts (38% into Powell). This has prompted considerations for emergency releases to support Powell.
Reservoir | Current Elevation (ft) | Percent Full | Storage (acre-feet) | Notes |
Flaming Gorge (Green River) | ~6,022.55 | 82% | ~2,997,884 | Stable; potential emergency releases to Lake Powell. |
Blue Mesa (Gunnison River) | ~7,467.32 | ~50% | ~412,912 | Slight recent increase, but 51.7 ft below full; inflows at 54% of average. |
Navajo (San Juan River) | ~6,032.95 | 60% | ~988,517 | Minor decline; inflows forecasted at 48% of average. |
These reservoirs operate under dry conditions, and population growth in states such as Colorado (a 725,000 increase from 2010 to 2020) heightens demand.
Situation Downstream from Lake Powell
Downstream in the Lower Basin, the focus is on Lake Mead's vulnerability, with releases from Powell projected at 7.48 million acre-feet (MAF) for 2026. The system faces a structural deficit of ~1.2 MAF annually from overuse and losses.
Reservoir | Current Elevation (ft) | Percent Full | Storage (acre-feet) | Notes |
Lake Mead (Hoover Dam) | ~1,065.91 | 34% | ~8,878,000 | Weekly gains, but projected drop; Tier 1 shortage. |
Lake Mohave (Davis Dam) | ~641.52 | ~96% | ~1,717,603 | Stable, high for power delivery. |
Lake Havasu (Parker Dam) | ~447.31 | ~84% | ~518,318 | Recent gains; run-of-river operation. |
Population surges in Lower Basin states, such as California's 2.3 million growth from 2010 to 2020, exacerbate demands.
Key Causes of the Crisis
Warmer Weather Patterns
Warmer temperatures have accelerated evaporation from reservoirs and altered snowmelt timing, reducing efficient runoff into the system. This contributes to lower inflows, amplifying dry conditions during prolonged megadroughts that have persisted for over two decades.
Population Growth
Rapid expansion in basin states has outpaced water availability. The current population of ~40 million is projected to reach 49-76 million by 2060, driving demand from 18.1 MAF to 20.4 MAF annually. States such as Arizona (+760,000 from 2010-2020), Colorado (+725,000), and California (+2.3 million) prioritize growth, thereby straining allocations under the 1922 Compact.
State/Region | Population Growth (2010-2020) | Projected Increase by 2030 (from 2000) |
Arizona | +760,000 | Part of 53% basin average |
Colorado | +725,000 | Part of 53% basin average |
California | +2.3 million | Part of 53% basin average |
Basin Total | ~40M current | Up to 76M by 2060 (high scenario) |
Poor Water Management Practices
A significant share of the blame falls on state and federal agencies. The 1922 Colorado River Compact over-allocated 15 MAF against an average flow of 12-13 MAF, based on outdated wet-period data. Agencies such as the Bureau of Reclamation and state water boards have failed to revise this, resulting in chronic deficits. Missed negotiation deadlines, such as February 14, 2026, highlight interstate stalemates: Lower Basin states proposed cuts (e.g., California 10%, Arizona 27%), but the Upper Basin resisted. The 2019 Drought Contingency Plans provided temporary cuts but expire in 2025, with uneven enforcement favoring agriculture (80% of use). "Use it or lose it" policies encourage waste, and slow integration of environmental needs has degraded ecosystems.
Management Failure | Responsible Agencies | Impact on System | Tie to Population Growth |
Over-Allocation in 1922 Compact | Federal (Bureau of Reclamation), State Water Boards | Chronic 1-1.5 MAF deficits | Not adjusted for growth in CA (2.3M increase) |
Missed Negotiation Deadlines | Seven Basin States, Federal Interior Dept. | No consensus on cuts | Delays responses to 40M+ residents |
Inadequate DCP Enforcement | Federal, Basin States | Uneven cuts | Favors agriculture amid urban expansion |
Impacts on Communities, Tourism, and Agriculture
Communities like Page, Arizona, and the Navajo Nation face rising energy costs (e.g., $4.5 million in 2025 for Navajo utilities) from reduced hydropower (down 25%). Tourism in Glen Canyon National Recreation Area has suffered, with 11 boat ramps closed and losses of $23-30 million regionally; Page's tourism spending is down 25-30%. Agriculture, which consumes 80% of water and irrigates 5.5 million acres, faces cuts in Arizona and Utah, leading to lower yields, higher food prices, and compensation demands.
Government Plans to Address the Crisis
The Bureau of Reclamation's post-2026 guidelines process includes a January 2026 Draft Environmental Impact Statement evaluating five alternatives for releases and reductions through 2060. With states missing deadlines, federal intervention is likely by October 2026. Proposals include 3 MAF in conservation by 2026, with $4 billion from the Inflation Reduction Act funding efficiency programs, infrastructure upgrades, and Tribal consultations for equitable solutions.
Conclusion
The crisis at Lake Powell and Lake Mead underscores a fragile balance that has been disrupted by warmer patterns, unchecked population growth, and flawed management. Without swift reforms, risks to water security, power, and economies will escalate. Ongoing negotiations offer hope, but action must match the urgency to sustain this vital resource.


